XiaoMi-AI文件搜索系统
World File Search Systemeconomy
The impact of the Russia-Ukraine War on the U.S. Economy
The Russia-Ukraine war, which began in February 2022, has significantly impacted the global economic landscape, with profound effects on the United States economy. This paper provides a comprehensive analysis of these impacts [3]. The study highlights how the conflict has disrupted supply chains, escalated inflation, and influenced U.S. monetary and fiscal policies. Key findings indicate that higher energy and food prices have accelerated inflation, leading the Federal Reserve to increase interest rates and implement quantitative tightening measures [12]. Concurrently, the U.S. government has responded with substantial fiscal measures, including increased defence spending, energy sector support, and economic aid packages [17]. The paper also discusses the broader implications of the war on global trade, supply chains, and geopolitical alliances. By examining the interplay between these factors, the study provides insights into the policy measures needed to mitigate the adverse effects of the conflict and enhance economic resilience. The findings underscore the importance of adaptive strategies and international cooperation in navigating the complex economic challenges posed by the Russia-Ukraine war.
On the Political Economy of Nonlinear Income Taxation
本文引用了有关投票、最优所得税、实施和纯公共物品的文献,以解决通过投票决定通过所得税来资助公共物品的问题。与以前的文章不同,本文允许征收影响工作和投票的消费者的劳动休闲决策的一般非线性所得税。不确定性起着重要作用,因为政府不知道从已知分布中抽取的消费者能力的真实实现,但必须满足与实现相关的预算;税收制度必须是稳健的。即使备选方案空间是无限维的,原始条件也能确保多数规则均衡的存在。JEL 编号:D72、D82、H21、H41 关键词:投票;所得税;公共物品;稳健性
Differentiating Small Enterprises in the Innovation Economy:
The recovery which followed in the 2010s was, in many ways, uneven and highly inequitable, with growth not being equitably distributed across sectors, communities or regions. With areas and people feeling ‘left behind' while others benefited from the recovery, this resulted in social, economic and political disruptions. If we wish the recovery of the 2020s to be more inclusive across a diverse set of actors, then we need to adopt an approach that is consciously inclusive and allows us to build back the entrepreneurial foundations of our economies in a different, more equitable way. An effective and inclusive approach to enterprise support requires that we attend to corner stores and ‘main street/high street' SME businesses, not just unicorns and high-tech start-ups. It requires an emphasis on productivity and employment, not simply revenue growth or valuation, and demands that we consider differentiation in support as well as coherence and simplification.
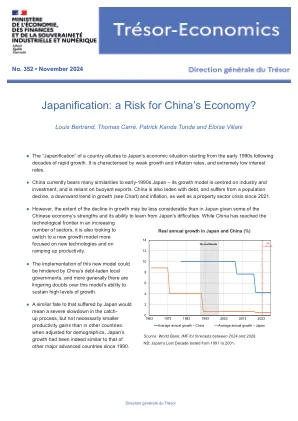
Japanification: a Risk for China's Economy?
中国的通胀趋势也呈下降趋势:1980 年至 2009 年间,通胀率平均为每年 6.1%,2010 年至 2019 年间降至 2.6%(见图 4),并在 2024 年 1 月跌至 2010 年以来的最低点,同比下降 -0.8%。不过,中国 4 的通胀率应保持结构性低位,原因与日本不同(日本自 1990 年代开始出现通货紧缩螺旋)。这些原因是:(i) 供给相对于需求增加,而家庭消费占 GDP 的比重较低(2022 年为 37%,而 OECD 国家平均为近 60%)5(见下文);(ii) 城市化进程持续,由于新城镇居民进入劳动力市场并愿意接受较低的工资,导致工资受到抑制;(iii) 食品和能源价格继续受到管制; 6;(四)竞争激烈,企业纷纷降低价格以抢占市场份额,甚至不惜牺牲利润率。
Market Size and Institutions in a Global Economy∗
1 Another important piece of evidence is the Atlantic trade, as shown by Acemoglu et al. ( 2005 ). Even though they emphasize the role of the differential medieval institutions among Atlantic traders (England and the Netherlands vs. France, Portugal, and Spain) in their subsequent institutional reforms, the rise of Atlantic trade due to the breakthrough in navigation is the precondition for these institutional reforms. Namely, when the economic benefits of institutional reforms were higher for Atlantic traders than for the rest of Europe, the reforms were more likely to occur there. The fact that non-Atlantic-trader European nations also made their reforms much earlier than the rest of the world may also be due to the growing neighboring markets, in addition to competition and the spread of knowledge.

费率和服务指南 UPS® Worldwide Economy
出发国家/地区 华南地区 出发国家/地区 华南地区 目的地国家/地区 美国* 目的地国家/地区 美国* 重量(公斤) 7 区 重量(公斤) 7 区 0.1 人民币 99.23 6 人民币 1740.20 0.2 人民币 198.46 7 人民币 1984.78 0.3 人民币 297.70 8 人民币 2234.33 0.4 人民币 396.93 9 人民币 2482.27 0.5 人民币 496.16 10 人民币 2728.60 0.6 人民币 497.90 11 人民币 2900.38 0.7 人民币 499.63 12 人民币 3119.62 0.8 人民币 501.37 13 人民币3342.15 0.9 人民币 503.10 14 人民币 3562.23 1 人民币 504.84 15 人民币 3781.47 1.1 人民币 552.46 16 人民币 4003.23 1.2 人民币 600.09 17 人民币 4233.11 1.3 人民币 647.71 18 人民币 4469.57 1.4 人民币 695.34 19 人民币 4702.81 1.5 人民币 742.96 20 人民币 4936.68 1.6 人民币 745.55 21 人民币 5010.73 1.7 人民币 748.15 22 人民币 5075.84 1.8 人民币 750.74 23 人民币 5306.56 1.9 人民币 753.34 24 人民币 5537.28 2 人民币 755.93 25 人民币 5768.00 2.5 人民币 990.64 26 人民币 5998.72 3 人民币 1007.93 27 人民币 6229.44 3.5 人民币 1235.92 28 人民币 6460.16 4 人民币 1257.48 29 人民币 6690.88 4.5 人民币 1479.60 30 人民币 6921.60 5 人民币 1505.35 UPS® 全球经济型 30 公斤以上的货件 始发国家/地区 华南地区 目的地国家/地区 美国* 重量(公斤)区域 7 每公斤价格人民币 230.72 最低人民币 6921.6 本表所有货币均以人民币列出 *仅限美国48个州。不包括夏威夷和阿拉斯加

Chanel 影响案例研究 Gig Economy vf
本文件中包含的未来预测、管理目标、估计、前景或回报。在不影响欺诈责任的情况下,Channel Capital Advisors LLP 的任何成员均不接受也不会接受与本报告有关的任何责任、义务或义务(无论是合同、侵权或其他)。本文中包含的信息是严格保密的,未经 Channel Capital Advisors LLP 的明确书面许可,不得以任何方式全部或部分披露、复制、分发或发布。收件人承诺不将任何机密信息用于任何非法目的。其中包含的信息仅供预期收件人使用,禁止向未经授权的人员共享此信息。如果您不是预期收件人,则禁止披露、复制、分发或依赖此信息采取任何行动,并且可能是非法的。如果您不是预期收件人,请将电子邮件退回给发件人,并
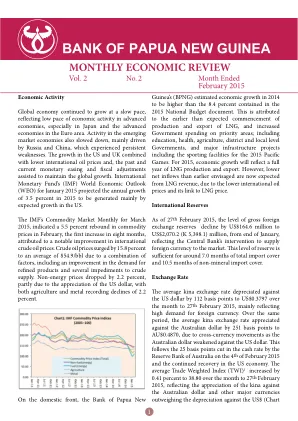
Economic Activity Global economy continued to grow at a ...
The average kina exchange rate depreciated against the US dollar by 112 basis points to US$0.3797 over the month to 27 th February 2015, mainly reflecting high demand for foreign currency. Over the same period, the average kina exchange rate appreciated against the Australian dollar by 251 basis points to AU$0.4870, due to cross-currency movements as the Australian dollar weakened against the US dollar. This follows the 25 basis points cut in the cash rate by the Reserve Bank of Australia on the 4 th of February 2015 and the continued recovery in the US economy. The average Trade Weighted Index (TWI) 1 increased by 0.41 percent to 38.80 over the month to 27 th February 2015, reflecting the appreciation of the kina against the Australian dollar and other major currencies outweighing the depreciation against the US$ (Chart

费率和服务指南 UPS® Worldwide Economy
体重(公斤) 7 区 体重(公斤) 7 区 0.1 20.25 新加坡元 6 361.91 新加坡元 0.2 40.49 新加坡元 7 402.32 新加坡元 0.3 60.74 新加坡元 8 441.36 新加坡元 0.4 80.99 新加坡元 9 479.12 新加坡元 0.5 101.23 新加坡元 10 516.49 新加坡元 0.6 102.59 新加坡元 11 535.09 新加坡元 0.7 103.95 新加坡元 12 553.85 新加坡元 0.8 105.31 新加坡元 13 571.33 新加坡元 0.9 106.67 新加坡元 14 587.94 新加坡元 1 新加坡元108.02 15 604.47 新加坡元 1.1 116.26 新加坡元 16 624.19 新加坡元 1.2 124.49 新加坡元 17 643.92 新加坡元 1.3 132.72 新加坡元 18 658.85 新加坡元 1.4 140.96 新加坡元 19 669.06 新加坡元 1.5 149.19 新加坡元 20 681.20 新加坡元 1.6 151.19 新加坡元 21 700.90 新加坡元 1.7 153.20 新加坡元 22 734.27 新加坡元 1.8 155.20 新加坡元 23 767.65 新加坡元 1.9 157.20 新加坡元 24 801.02 新加坡元 2 159.20 新加坡元 25 834.40 新加坡元 2.5 198.58 新加坡元 26 867.78 新加坡元 3 211.90 新加坡元 27 901.15 新加坡元 3.5 249.83 新加坡元 28 934.53 新加坡元 4 266.59 新加坡元 29 967.90 新加坡元 4.5 301.01 新加坡元 30 1,001.28 新加坡元 5 321.20 新加坡元 UPS® 全球经济舱 30 公斤以上的货件 始发国家/地区 新加坡 目的地国家/地区 美国* 重量(公斤) 区域 7 每公斤价格 33.38 新加坡元 最低 1,001.28 新加坡元 本表中的所有货币均以新加坡元列出 *仅限美国 48 个州。不包括夏威夷和阿拉斯加

Environmental financing: does digital economy matter?
可持续发展和生态修复是世界各国为缓解经济增长与环境之间的冲突而追求的共同目标。数字经济在解决此类冲突中发挥了重要作用。本研究旨在通过评估特定城市的时间和行业特定动态来确定数字融资与环境融资之间的关系,并确定数字经济对当前环境投资和成本的副作用。特别关注数字经济对总体环境融资及其组成部分的影响,即环境投资和当前环境保护成本。作者提出了两个指标来评估数字经济的影响,即数字融资(直接影响)和数字资本(间接影响)。为了计算这些指标,作者开发了自己的方法。使用最小二乘法对年度标准差和个体固定效应进行聚类,检验数字经济对环境融资的影响。研究数据取自俄罗斯联邦国家统计局 (Rosstat) 2012 年至 2022 年的数据。我们的研究结果表明,数字融资对环境融资产生了显著的积极影响,这表明经济中的两个动态过程——数字化转型和引入先进的环境数字技术——是同步的。作者证明,由于数字技术渗透到环境保护技术中所产生的影响,数字投资刺激了环境投资的相应增长。我们表明,通过数字资本指数评估的人口、公司和国家的数字化水平对环境融资有积极影响。研究结果可用于公共政策领域。